How to Use ClimateBase for Renewable Energy Planning
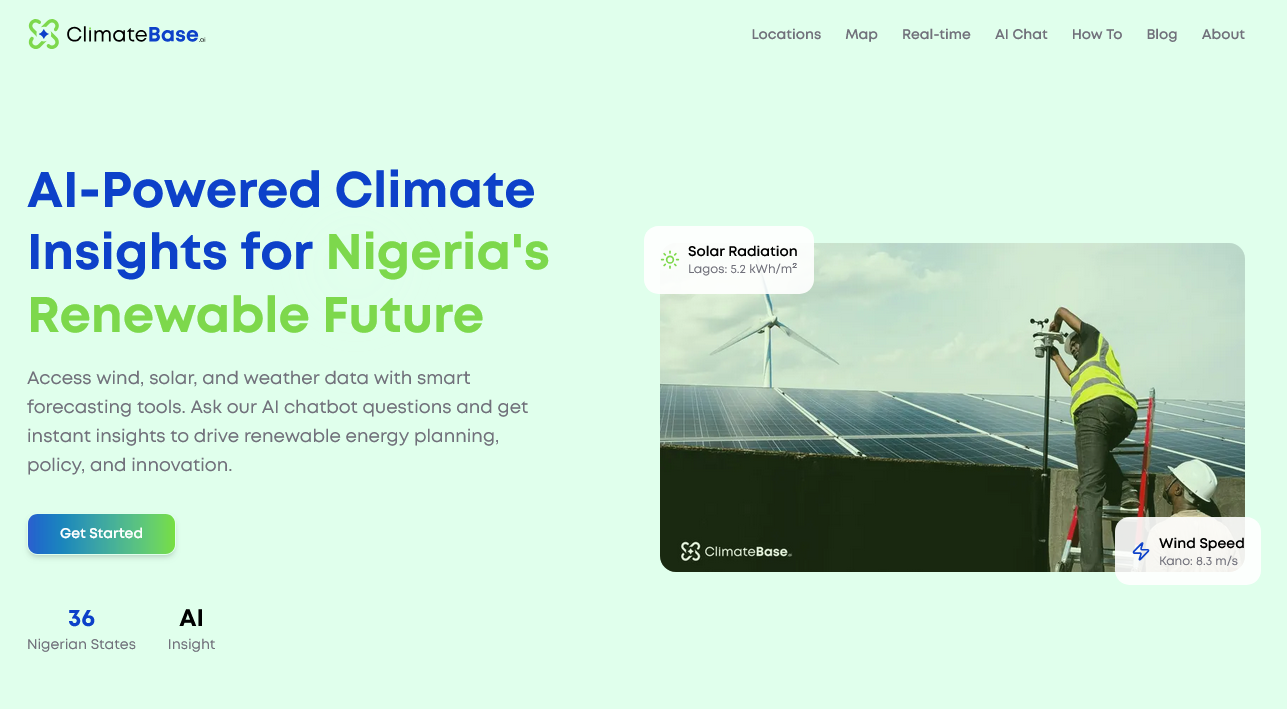
A step-by-step guide to accessing wind, solar, and weather data on ClimateBase. Learn how to explore locations, use the AI chatbot, and make data-driven decisions for renewable energy projects across Nigeria.
ClimateBase gives you access to wind, solar, and weather data across all 36 Nigerian states. Whether you’re planning a solar farm, assessing wind resources, or doing policy research, this guide will help you get started.
Getting started
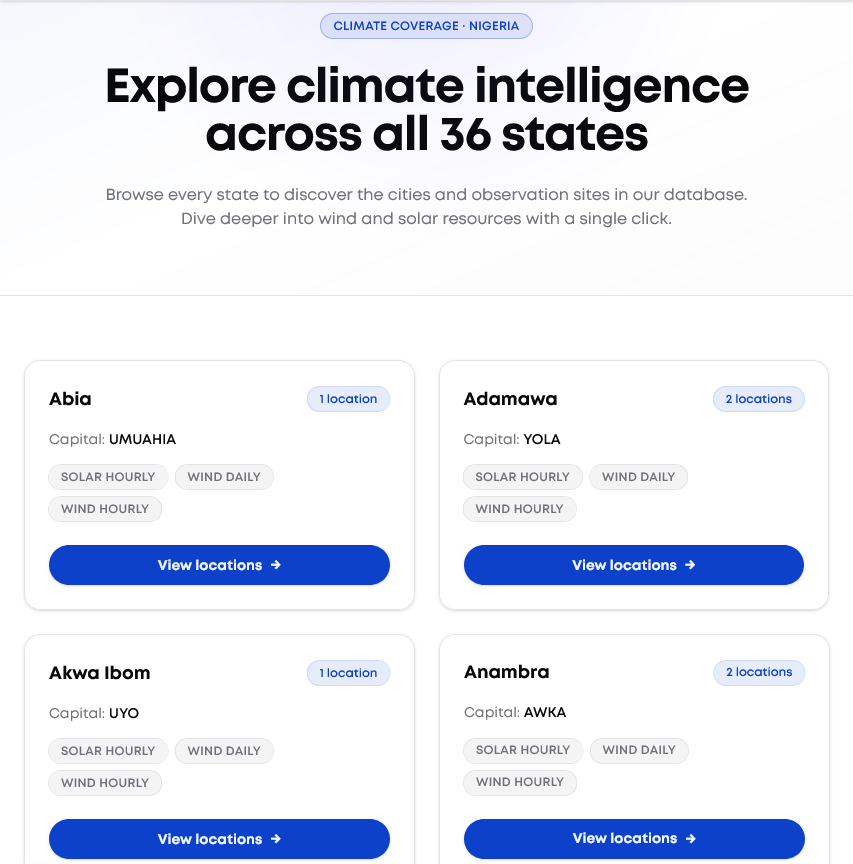
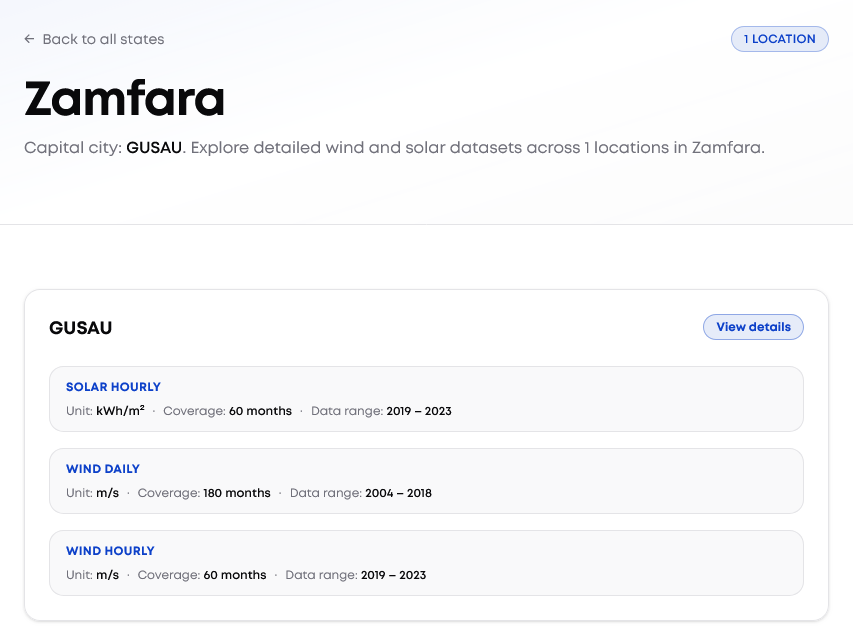
Explore locations: Go to the Locations page to browse states and cities. Each location shows available data types (wind hourly/daily, solar hourly) and coverage periods. You can filter by state and see which sites have the data you need.
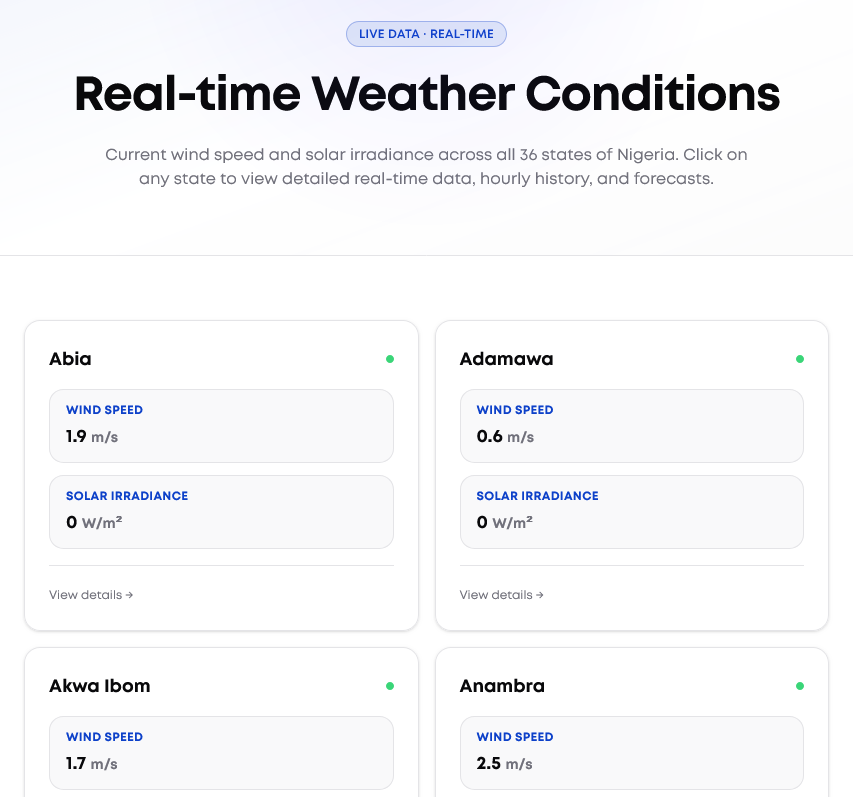
View real-time data: The Real-time page shows current wind speed, solar irradiance, and weather for every state. Click a state to see hourly history and 5‑day forecasts. Use this to check current conditions before diving into historical series.
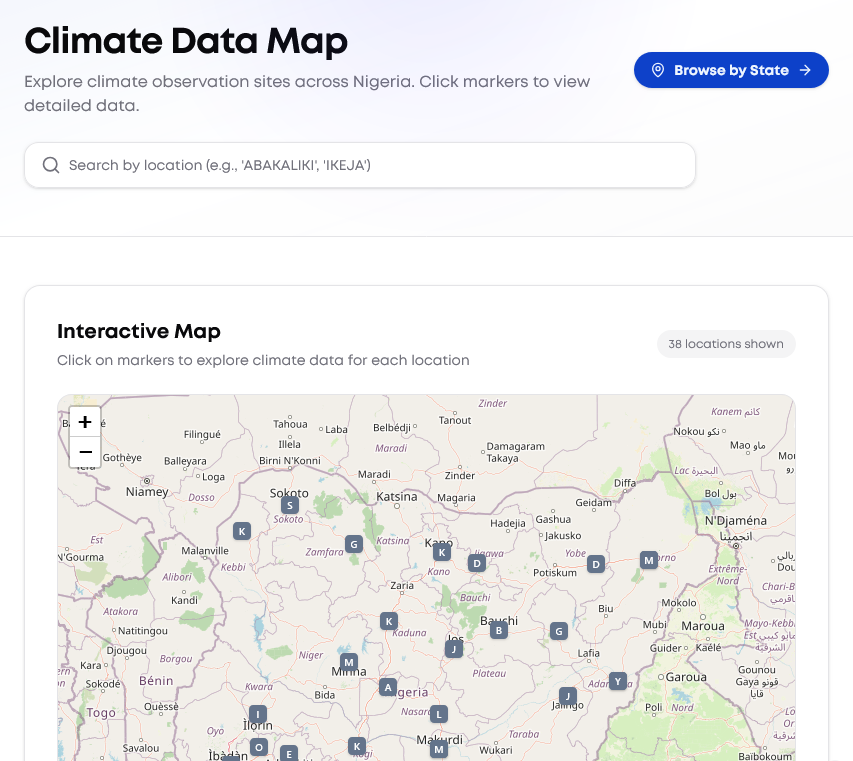
Use the interactive map: The Map lets you explore Nigeria visually. Click any location to view detailed climate info. Handy for site selection and comparing neighbouring areas.
Using the AI chatbot
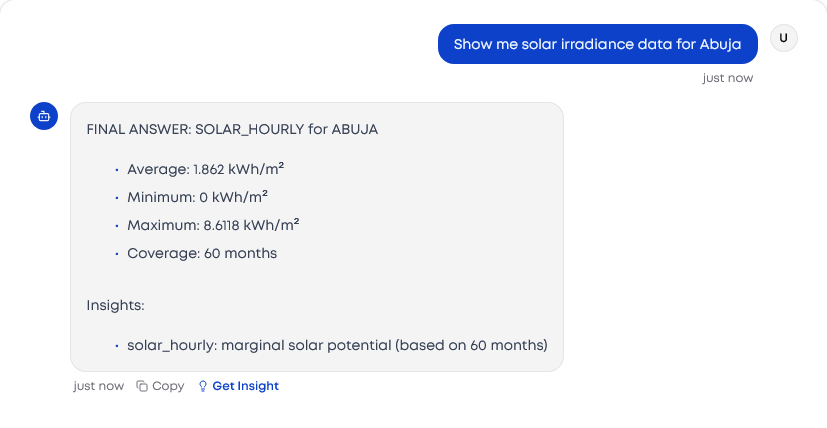
Ask questions in plain language. For example: “What’s the average wind speed in Lagos?” or “Compare solar data between Kano and Abuja.” The AI uses our datasets and returns concise answers, comparisons, and suggestions.
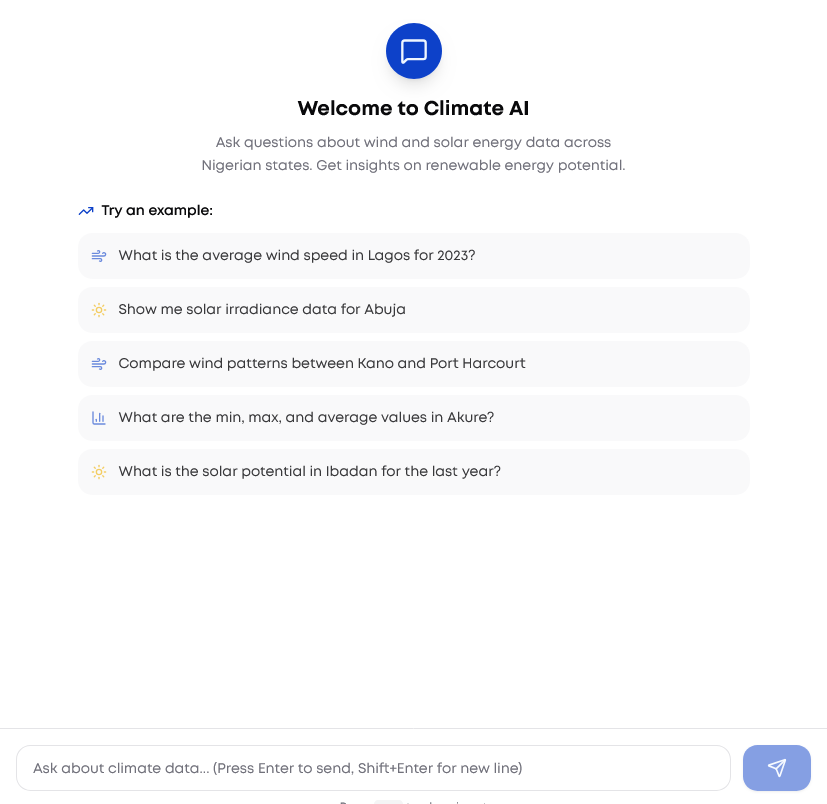
You can ask follow‑ups to go deeper. The chatbot keeps context, so you can refine queries without starting over.
Exploring climate data
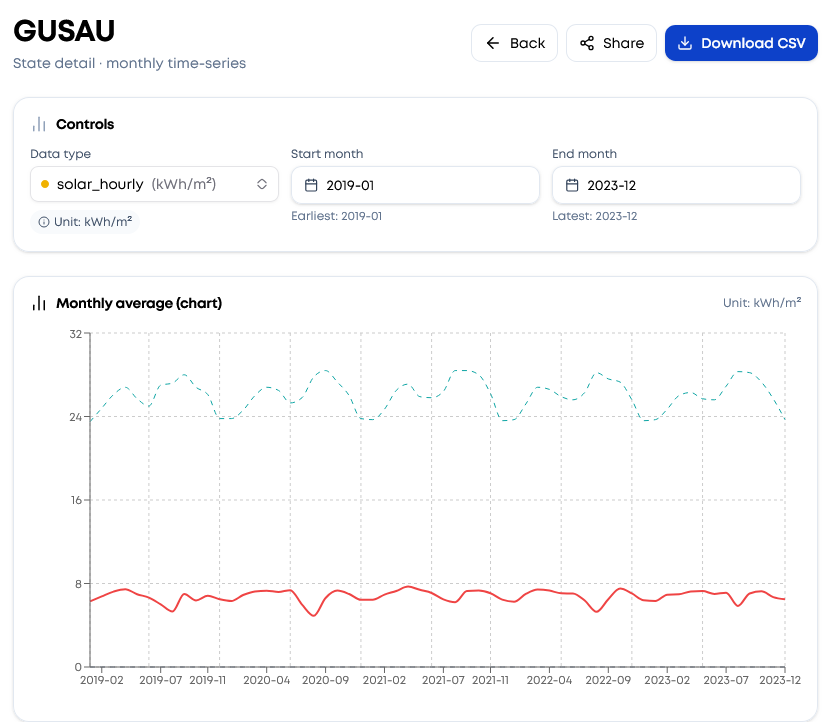
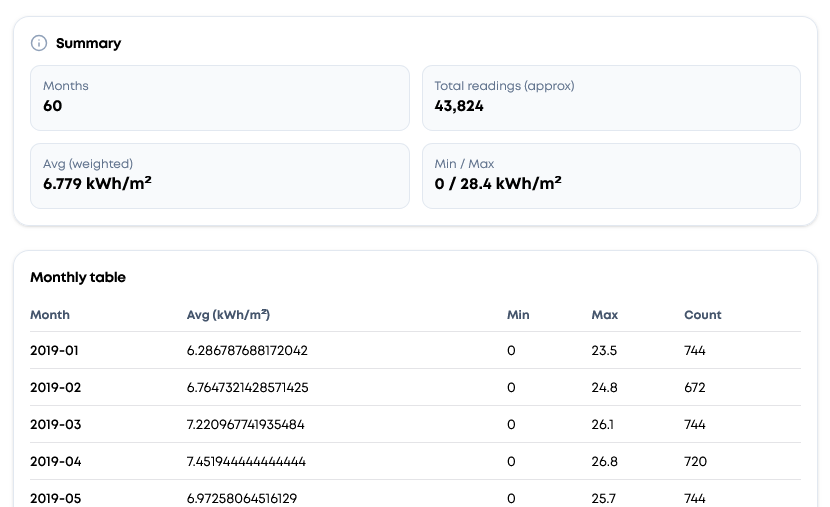
Pick a location, then choose wind or solar data. You’ll see averages, minimums, maximums, and coverage periods. Use the charts to spot trends, seasonal patterns, and outliers. Export data when you need it for offline analysis or reports.
Making decisions
Use the platform to compare sites, check inter‑annual variability, and gauge solar and wind potential. Combine map, real‑time, and historical views to support feasibility studies, investor briefs, or academic work.
Ready to start? Head to Locations, Map, or AI Chat on ClimateBase.